
AMD .786 breakout level that would setup a huge wave 3 to this target
AMD, or Advanced Micro Devices Inc., has been a favorite among traders and investors alike, thanks to its strong performance in the semiconductor space and its ability to consistently deliver impressive results. As with any stock, however, AMD can experience significant price movements, which is where the Elliott Wave and Fibonacci analysis come in handy.
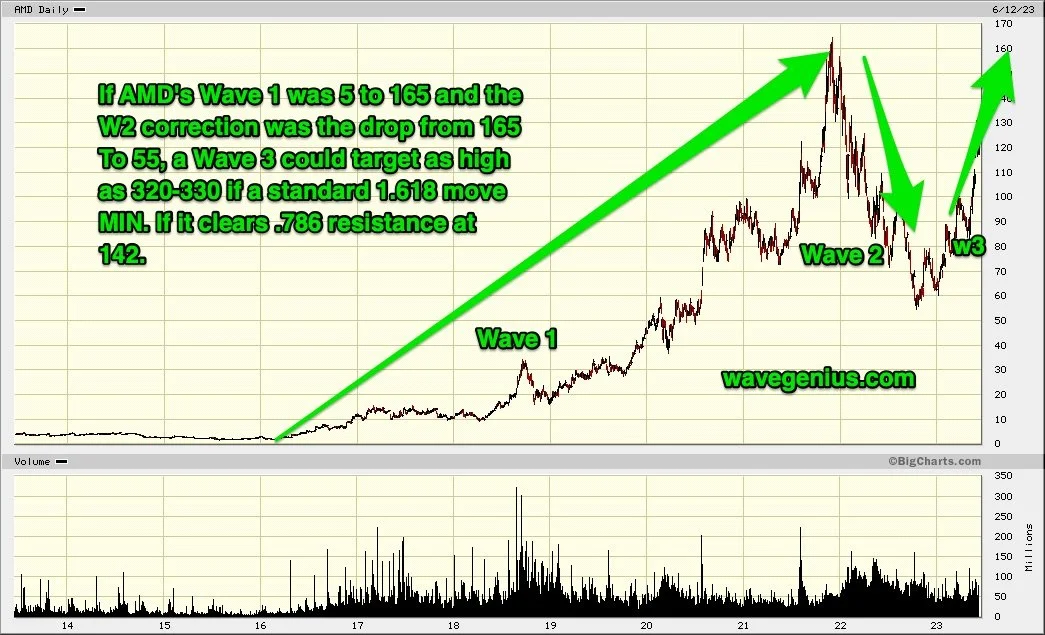
According to the master Elliottician Ted Aguhob, if AMD manages to break through the resistance level of 142 or the .786 Fibonacci resistance level, the stock could experience a rally that could send the price as high as 320-330 in a wave 3.
To understand this analysis, let's take a closer look at the Elliott Wave theory. Elliott Wave theory is a type of technical analysis that is based on the assumption that stock prices move in a pattern of five waves in the direction of the larger trend, followed by a correction in three waves against the larger trend. These patterns can be seen in all markets and timeframes, and can help traders identify potential entry and exit points.
The Fibonacci sequence is a series of numbers where each number is the sum of the two preceding numbers. The sequence looks like this: 0, 1, 1, 2, 3, 5, 8, 13, 21, 34, 55, 89, and so on. The Fibonacci ratios, derived from this sequence, are widely used in technical analysis and are believed to help identify key levels of support and resistance in the market.
According to Ted Aguhob, if AMD manages to break through the resistance level of 145 or the .786 Fibonacci resistance level, it could trigger a wave 3, which is typically the strongest and the most extended wave of the Elliott Wave pattern. This wave could send the stock price as high as 320-330 in the coming months.
However, it's important to remember that no analysis is foolproof, and stock prices can move in unexpected ways. Traders and investors should always use a combination of technical and fundamental analysis to make informed decisions.
In conclusion, the Elliott Wave and Fibonacci analysis can be useful tools for traders and investors to identify potential entry and exit points in the market. According to Ted Aguhob, if AMD manages to break through key resistance levels, it could rally to as high as 320-330 in a wave 3. However, as with any analysis, it's important to remember that there are no guarantees in the market.