
AMZN to 380-400 in an Elliott Wave 3 on this breakout level (CHART)
AMZN's Phenomenal Ascent: A Fresh Look at Impending Elliott Wave Rally
I. Introduction
Amazon (AMZN) has soared to a place of prominence in the equity markets over the past decade. A perennial favorite among investors, AMZN has been a wealth creator, multiplying its value by tenfold. This increase in value was not a random occurrence, but rather the result of a series of predictable patterns known as the Elliott Wave Principle.
II. Understanding the Elliott Wave Principle
At the core of AMZN's impressive ascent is the Elliott Wave Principle. This concept, coined by Ralph Nelson Elliott, outlines a recognizable pattern in market trends. The Elliott Wave Principle proposes that market trends move in cycles or waves, each wave symbolizing a particular phase in the market’s sentiment.
III. The First Wave: The Rise of AMZN
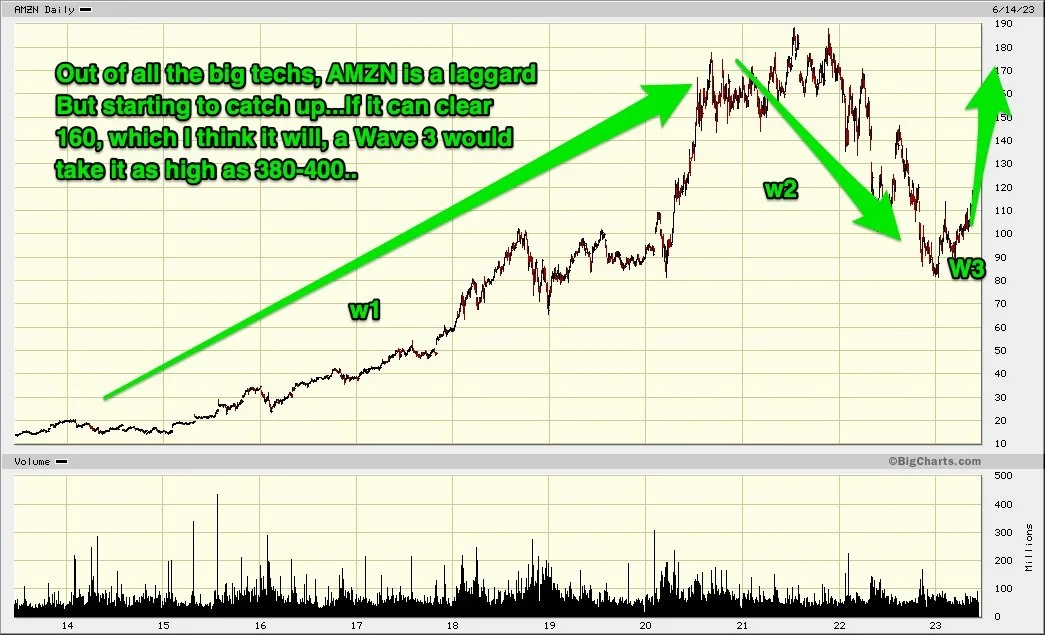
As we delve into the first wave of AMZN's ascent, we notice a staggering rise from 15 to 188, a tenfold increase in its value over the past decade. This first wave peaked with a 5 of 5, marking the end of the upward trend before the commencement of a corrective second wave.
IV. The Second Wave: The Correction
The second wave witnessed a sharp decline in AMZN's value from 188 to 80. However, the stock managed to uphold the .618 Fibonacci support level, indicating a strong inclination towards a downward impulse or zigzag wave.
V. Understanding Fibonacci Retracements
Fibonacci retracements, named after the Italian mathematician Leonardo Fibonacci, are a popular tool for predicting potential support and resistance levels in finance. These retracements are based on the key Fibonacci ratios of 23.6%, 38.2%, 61.8%, and 78.6%, which are derived from the Fibonacci sequence.
VI. The .786 Fibonacci Breakout
A breakout from the 160 level, a plausible scenario considering the bullish market conditions, would signify a .786 Fibonacci breakout. In the context of AMZN, this could potentially initiate a third wave, propelling the stock's value to the 380-400 range.
VII. The Third Wave: The Anticipation
The breakout of 160 is not just a number, but a potential trigger to an anticipated Wave 3. According to the Elliott Wave theory, this third wave could potentially drive AMZN's value as high as 380-400, marking a new era of growth for the e-commerce giant.
VIII. Market Conditions and AMZN
Current market conditions suggest a bullish trend, lending credence to the possibility of a third wave. The unprecedented growth of the digital economy, accelerated by the pandemic, has bolstered AMZN's market position, making the .786 Fibonacci breakout a real possibility.
IX. Conclusion
In conclusion, the Elliott Wave theory applied to AMZN's market behavior presents an interesting perspective. The stock's performance, when viewed through the lens of this theory, provides intriguing insights into its potential future trajectory.
X. Disclaimer
While the Elliott Wave theory and Fibonacci retracements provide a mathematical framework for predicting market trends, they are not foolproof. Market trends are influenced by a myriad of factors, and the predictions based on these theories should be considered alongside other market indicators and financial advice.