
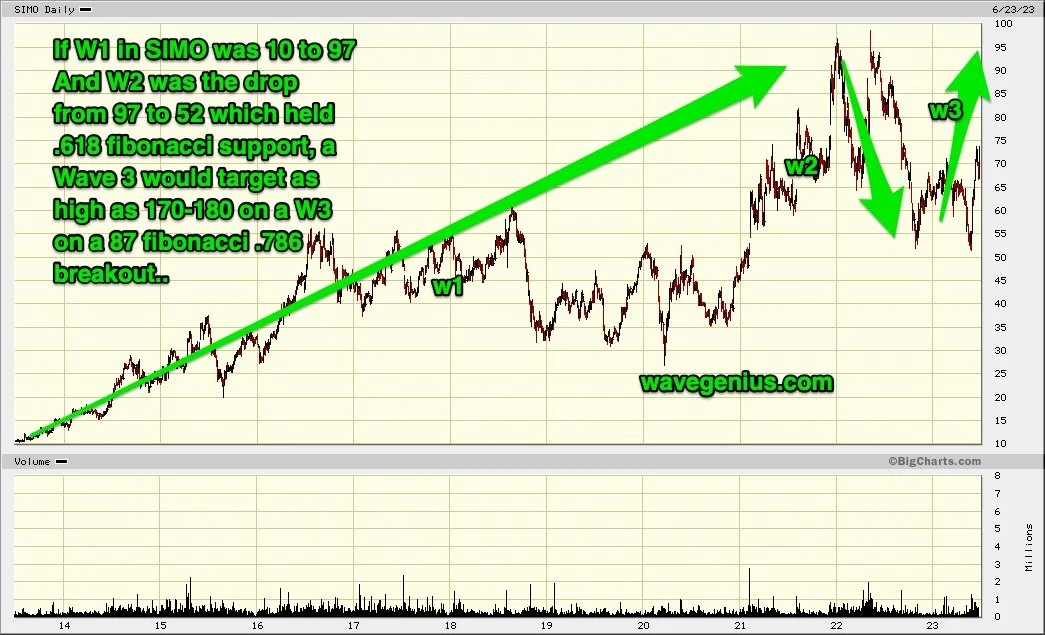
SIMO to 180 Elliott Wave 3 Upon .786 Fibonacci Breakout
Understanding the SIMO to 180 Elliott Wave 3 with .786 Fibonacci Breakout
This article unfolds the fascinating world of SIMO to 180 Elliott Wave 3 upon a .786 Fibonacci Breakout. A deep dive into this narrative will unravel the intriguing patterns of waves and Fibonacci series, illustrating the dynamics of the SIMO stock market.
The Journey of SIMO
Silicon Motion Technology Corporation, known as SIMO, has a compelling journey in the stock market. The evolution of SIMO prices can be understood through the lens of the Elliott Wave Theory.
SIMO Stock Chart
The Elliott Wave Theory
The Elliott Wave Theory, proposed by Ralph Nelson Elliott, is a popular tool among traders. It postulates that market prices unfold in specific patterns, referred to as waves.
def elliott_wave_theory(price_data):
# Analyze the price data using Elliott Wave Theory
return wave_analysis
Wave 1: The Initial Surge
The first wave in the journey of SIMO was a significant surge from 10 to 97. This powerful upward wave set the stage for a promising trend for SIMO.
Wave 2: The Zigzag
Wave 2 was a zigzag pattern that dropped the price from 97 to 52. Despite the decline, the price managed to hold the .618 Fibonacci support.
"The zigzag pattern in wave 2 is a common characteristic in Elliott Wave Theory," remarked Ted Aguhob, a well-known analyst.
Understanding the .618 Fibonacci Support
The .618 Fibonacci support is a critical level in Fibonacci retracement, which traders consider a major reversal point.
Wave 3: The Determinant
The third wave is the most crucial phase in the Elliott Wave sequence. For SIMO, wave 3 is still in progress. However, it will be confirmed on a breakout above 87.
Wave 1: 10 to 97
Wave 2: 97 to 52
Wave 3: In Progress
The .786 Fibonacci Breakout
The .786 Fibonacci breakout is a significant event that traders keenly observe. It can potentially trigger a bullish or bearish wave, depending on the market conditions.
The Target: 180
With a successful .786 Fibonacci breakout, the target for SIMO is set at 180. This ambitious target would mark a new high for SIMO, reflecting strong investor confidence.
Wrapping Up
In conclusion, the journey of SIMO, seen through the lens of the Elliott Wave Theory and Fibonacci retracement, presents an exciting narrative of the stock market's dynamics. This unique perspective aids traders in making informed decision