
AMAT Elliott Wave Long Term W3 Golden Ratio Target On This Fibonacci .786 Breakout (CHART)
Unraveling the Potential of AMAT: A Comprehensive Analysis of the Elliott Wave Theory and Fibonacci Breakouts
Introduction
In the dynamic world of investing, it's crucial to uncover hidden opportunities that can lead to substantial gains. One such opportunity lies within the stock of Applied Materials Inc. (AMAT). In this article, we will delve into the fascinating world of technical analysis, specifically the application of the Elliott Wave Theory and Fibonacci breakouts, to understand the potential future trajectory of AMAT's stock price. By examining historical patterns and employing these powerful analytical tools, we aim to uncover valuable insights that can guide investors in making informed decisions. So, let's embark on this journey of exploration and unravel the potential of AMAT.
Understanding the Elliott Wave Theory
The Elliott Wave Theory, developed by Ralph Nelson Elliott in the 1930s, is a powerful tool used to analyze and predict price movements in financial markets. It suggests that market trends unfold in a series of waves, with alternating patterns of upward and downward movement. These waves are labeled numerically and are further categorized into impulse waves (1, 3, 5) and corrective waves (2, 4).
Analyzing AMAT's Historical Waves
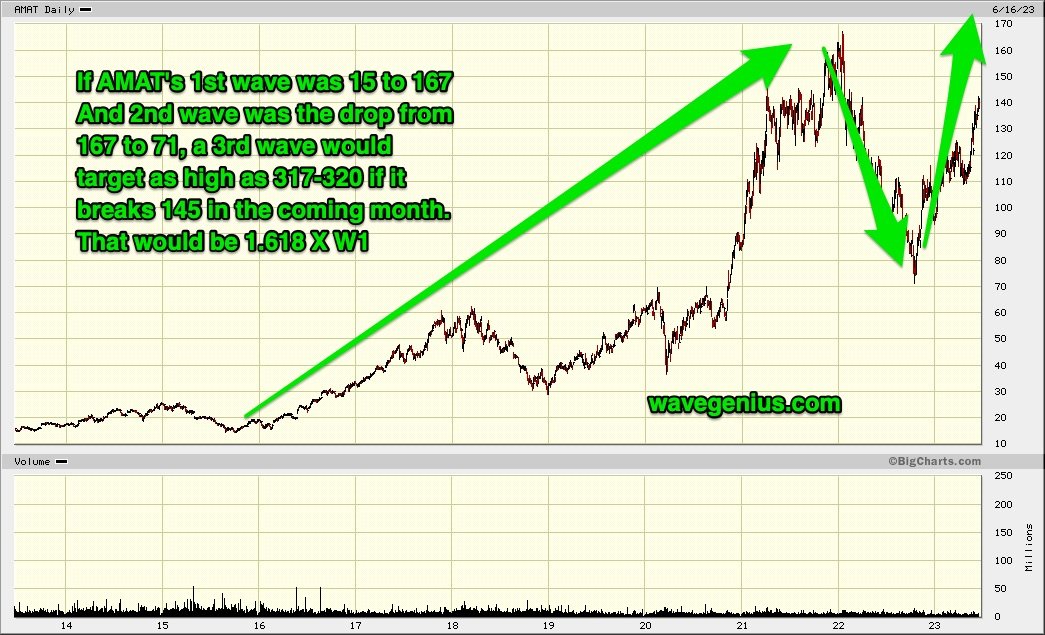
To apply the Elliott Wave Theory to AMAT, let's examine its historical price movements. AMAT's first wave witnessed a remarkable ascent, soaring from 15 to 167 in a powerful five-wave impulse. This demonstrated the potential for substantial gains within the stock. The subsequent correction, labeled as the second wave, saw a zigzag pattern from 167 to 71. This correction allowed the stock to consolidate before potentially resuming its upward trajectory.
Unveiling the Potential Third Wave Breakout
Currently, AMAT appears to be on the verge of a significant breakout. Should it surpass a .786 Fibonacci retracement level above 145, it could confirm the initiation of the third wave. This breakout holds the potential to propel AMAT's stock price to new heights.
The Golden Ratio and Wave 3 Target
According to the fascinating concept of the Golden Ratio, if AMAT's third wave travels 1.618 times the length of its first wave, it could reach an impressive target range of 317-320. This projection highlights the immense upside potential that may lie ahead for AMAT investors.
Unleashing the Power of Fibonacci Breakouts
Fibonacci levels play a crucial role in identifying potential support and resistance levels within the stock market. By applying these levels to AMAT's price movements, we can gain deeper insights into potential breakout points. The .786 Fibonacci retracement level has proven to be a critical threshold, often acting as a launching pad for powerful upward moves.
The Importance of Confirmation
While the technical analysis tools discussed thus far offer valuable insights, it's essential to wait for confirmation before making any investment decisions. Confirmation can come in the form of a decisive breakout above the .786 Fibonacci retracement level, along with supporting indicators such as increased volume and positive momentum.
Integrating Additional Information
In our quest to unravel the potential of AMAT, it's important to consider additional information that can impact the stock's future performance. Factors such as industry trends, company fundamentals, and macroeconomic indicators can provide a holistic perspective and help validate the findings of our technical analysis.
Conclusion
With a thorough understanding of the Elliott Wave Theory, Fibonacci breakouts, and additional relevant information, investors can gain a competitive edge in predicting the future trajectory of AMAT's stock price. By identifying potential breakouts and leveraging historical patterns, investors can make informed decisions and seize opportunities for significant gains. As always, it's essential to supplement technical analysis with comprehensive research and a well-diversified portfolio. So, embark on this exciting journey, armed with knowledge and insights, and unlock the potential of AMAT. Happy investing!
Disclaimer: This article is for informational purposes only and should not be construed as financial advice. Investing in the stock market involves risks, and readers are encouraged to conduct their own research and consult with a financial advisor before making any investment decisions.