
GOOGL Elliott Wave 3 To 280-300 on .786 breakout (CHART)
Riding the Elliott Wave: GOOGL's Surge from .786 Breakout to 280-300
Introduction
Investing in stocks is akin to navigating a turbulent sea, requiring a clear understanding of market trends and patterns. One such pattern is the Elliott Wave principle. In this article, we'll delve into the intriguing journey of Alphabet Inc. (GOOGL), and how it's riding the Elliott Wave towards a potential surge from a .786 breakout to 280-300.
Understanding The Elliott Wave Principle
The Elliott Wave principle is a form of technical analysis that investors use to analyze market cycles and forecast trends by identifying extremes in investor psychology, highs and lows in prices, and other collective activities. At its core, this principle plays a crucial role in deciphering the patterns that the stock market, like GOOGL, follows.
GOOGL's Trajectory
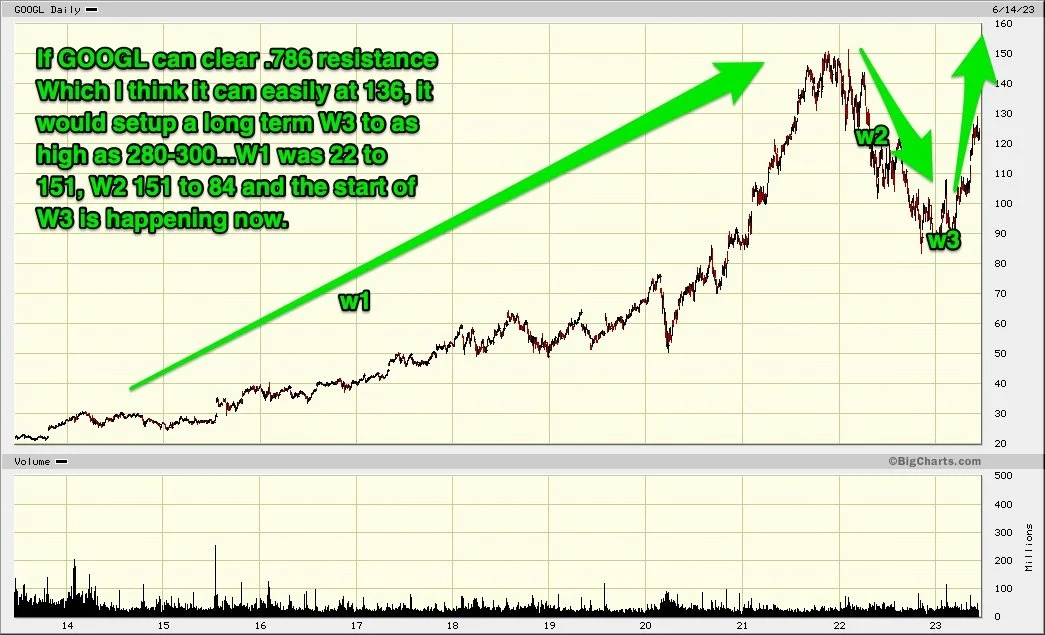
GOOGL's stock performance has been a roller-coaster ride, with significant highs and lows. The stock's first wave began its ascent from 22, reaching a peak at 151 before experiencing a steep decline. This trajectory was a classic example of the initial wave in the Elliott Wave principle.
The Second Wave: A Downward Spiral
The second wave, often characterized by a corrective phase, mirrored this principle accurately for GOOGL. From the pinnacle of 151, the stock plummeted to 84, marking a significant dip. This seemingly endless downward spiral was a classic illustration of the Elliott Wave's second phase.
Fibonacci and The Second Wave
The Fibonacci sequence, another critical tool in technical analysis, also had a part to play during this phase. GOOGL's stock, during its fall, managed to hold the .618 Fibonacci support, a crucial level for traders and investors.
The Emergence of The Third Wave
The third wave began at the 84 low, initiating a rally that saw a 65% increase from the lows. An additional 20% rise would surpass the 136 mark, setting up the Wave 3 for a potential surge to 280-300, provided it follows the 1.618 X wave 1 trajectory.
The Potential of Wave 3
The third wave, often the longest and strongest, holds immense potential for GOOGL. If it can clear the .786 resistance at 160, it would set up the third wave to catapult as high as 280-300. This bullish possibility is what investors are eyeing.
The Fibonacci Factor in Wave 3
A fascinating aspect of the potential surge is the Fibonacci factor. If the third wave manages to travel 1.618 X wave 1, it could clear the .786 resistance and set up a wave 3 to 280-300. This potential ascent is underpinned by Fibonacci ratios, further validating the Elliott Wave principle.
Conclusion
The journey of GOOGL, when analyzed through the lens of the Elliott Wave principle and Fibonacci ratios, paints a hopeful picture. With the possibility of the third wave propelling the stock to new heights, investors are on the edge of their seats, anticipating what could be a significant surge.
The Elliott Wave principle's power, coupled with Fibonacci ratios, offers an intriguing insight into the stock market's ebb and flow. As we continue to track GOOGL's trajectory, these tools will be instrumental in understanding and forecasting future trends.
Reference
It's important to remember that while the Elliott Wave principle and Fibonacci ratios can provide insight, they are not foolproof. Investors should use them as part of a broader strategy, taking into account other market indicators and their risk tolerance.
As we continue to watch GOOGL's journey, the interplay of the Elliott Wave principle and Fibonacci ratios promises to offer interesting insights. And who knows? Perhaps we'll witness the third wave's surge to 280-300, making for an exciting chapter in the annals of investment history.